Richmond, Texas · Fee-based fiduciary adviser

Any portfolio can fly in clear skies.Is yours built for the storm?

Holding on has worked. Here is what it assumes.

Every downturn of the past twenty-five years ended in a rescue, so investors who held on were made whole. Each rescue was paid for by borrowing from the future. Sonrise Opportunity manages long and short positions in no-load mutual funds across eight asset categories, each portfolio under a disclosed volatility ceiling: built to act in either direction, alongside what you already own.

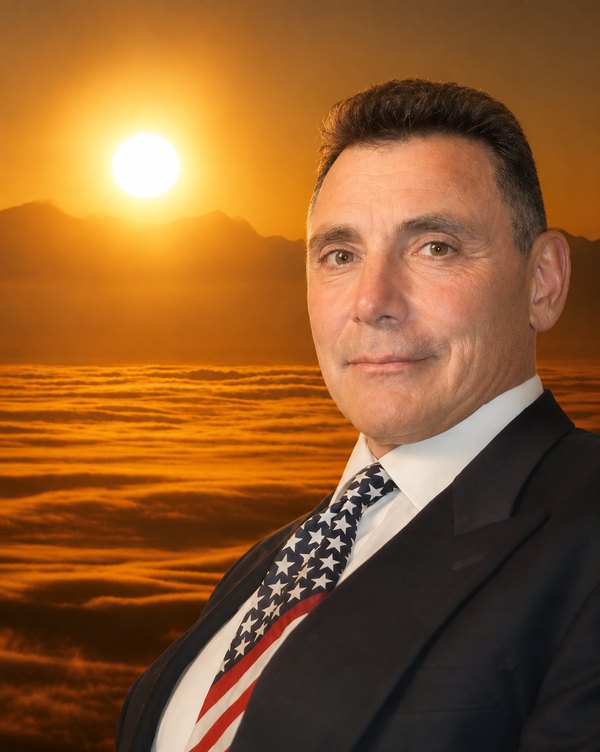
David J. Roskoph
David J. Roskoph, MBAOwner, President & Chief Compliance Officer. Former U.S. Air Force officer and World University Games athlete. 33 years in the securities industry, including ten years (2008–2018) managing a private investment partnership using long/short strategies.
On the record since 1999

David has read this sky in public for a quarter century.

  • 1999 KTTH Radio, on internet-stock valuation risk
  • 2007–11 23 Seeking Alpha articles, cautionary and constructive
  • 2008 Live on Fox Business, on debt and credit risk
  • 2008–18 Ten years managing long and short positions
See the record ↓
Act I

Barometer Falling

Reading the pressure before the storm. Not a garden-variety recession: decades of kicked cans, each one heavier than the last.

Barometer Falling · 1 · The Bill Is Already Here

We’ve borrowed from the future. Who pays the bill?

The bill isn’t coming. It’s already here.

U.S. public debt outstanding · estimated live
$40,273,024,579,219
$117,400 for every man, woman and child in the United States

Starts from the official U.S. Treasury figure of $40,273,024,579,219 on October 6, 2026 (Debt to the Penny) and advances at the past twelve months' average pace, about $6.5 billion a day. Per-person figure uses the Census Bureau's U.S. population estimate of about 343 million.

More on the debt$75,000 a second · $1 trillion in interest · the Fed’s 9×
  • $75,000Added to the federal debt every second. About $6.5 billion a day, every day, for the past year.U.S. Treasury, Debt to the Penny, 12 months to Oct. 6, 2026
  • $1 trillionSpent this year just on interest. Washington now pays more to service its debt than to defend the country.Congressional Budget Office; U.S. Treasury, fiscal 2026
  • 9×The Federal Reserve’s balance sheet, from under $1 trillion before the 2008 crisis to nearly $9 trillion at its 2022 peak. Two rescues, each bigger than the last, each paid for with money created or borrowed.Federal Reserve, H.4.1 statistical release
Barometer Falling · 2 · Who’s Left to Pay

The people paying the bill are disappearing.

Every generation after the boomers has paid into Social Security on a promise. But today’s workers pay today’s retirees, and each decade there are fewer workers, fewer babies to become the next ones, and longer retirements to fund. What happens when the people paying in start to doubt they’ll ever see it back?

Social Security retirement fund · projected to run dry
2,185days

until October 2032, the quarter the Trustees project the reserves are gone. From then, unless Congress acts, the cut is automatic: the law allows only what payroll taxes bring in, about 78 cents of every promised dollar.

And then what?

Who depends on the check, Medicare’s date, and the poverty math
1 in 5

older Americans collecting Social Security depend on it for 90% or more of their income. For them, a 22% cut is a 22% cut to almost everything.

2033

Medicare’s hospital insurance fund is projected to pay full benefits only until 2033. After that, about 89 cents of each promised dollar. 2026 Medicare Trustees Report.

10% → ~20%

Today 10.3% of Americans 65 and older live below the poverty line. One estimate finds the automatic cut would roughly double that rate.

Countdown: 2026 Trustees Report (OASI trust fund, fourth quarter 2032; 78% of scheduled benefits payable), counted from today’s date. Reliance: Social Security Bulletin, 2017 (19.6%–22.4% of beneficiaries 65+, 2012 income matched to SSA records). Poverty: Center on Budget and Policy Priorities from Census data, 2024 (37.6% would be poor without Social Security); doubling estimate, Biggs & Shapiro, Journal of Retirement, 2025.

The Social Security dilemmaWhy the math cannot work

Three forces squeeze the same promise from both ends: fewer children to become tomorrow’s workers, longer lives to fund in retirement, and so a growing share of each retiree resting on each worker.

  1. 19503.0314.06%
  2. 19603.6114.420%
  3. 19801.8216.231%
  4. 2025today1.5919.538%
  5. 2035projected1.6620.243%
  6. 2075projected1.7522.453%

Fewer workers, each carrying more of a retiree, for more years, with fewer children coming to replace them. Under current law, the Trustees project the retirement fund’s reserves run out in late 2032, when payroll taxes would cover about 78 cents of each promised dollar.

2026 Social Security Trustees Report: total fertility rate, period life expectancy at 65 (average of men and women), covered workers per beneficiary; 2035 and 2075 are the Trustees’ intermediate projections, not Sonrise Opportunity’s. Share carried is 1 divided by workers per beneficiary.

Barometer Falling · 3 · Two Americas

Two Americas. One vote each.

Every rescue raises the price of assets. Ten people out of a hundred own nearly nine-tenths of the stock market, so each rescue widens the gap between those who own and those who earn. Asset owners are not doing anything wrong. But every one of the hundred gets the same single vote. And ninety people out of a hundred hold the votes.

The rescues lifted what people own, not what they earn.

Growth since the end of 2008: what you own vs. what you earn
+764%
+11%
S&P 500A worker’s weekly pay, after inflation
Who owns the stock market, if America were 100 people

Drawn to scale. Growth: S&P 500 closes Dec. 31, 2008 (903.25) and Oct. 7, 2026 (7,801.77), price only; BLS median usual weekly real earnings, Q4 2008 to Q2 2026 (1982–84 dollars). Ownership: share of corporate equities and mutual fund shares held, by wealth group, Federal Reserve, Distributional Financial Accounts, Q2 2026 (top 1% 50.9% plus next 9% 37.2%; bottom 50% 0.6%; middle group by subtraction).

The last time ownership was this concentrated, in the 1910s, the votes rewrote the rules in four years: a federal income tax in 1913, new antitrust law in 1914 and a federal estate tax in 1916. Asset owners have the most to lose when the majority decides the rules need changing.

Concentration: Saez & Zucman, Quarterly Journal of Economics, 2016 (top 0.1% wealth share, peaks in 1916 and 1929). Dates: National Archives; IRS Statistics of Income. History, not a forecast.

The precedent22% credit card rates, the top 1% at 32.5% of wealth, and what followed the Gilded Age
22%

The average rate on credit card balances that are charged interest. For households without assets, this is the price of falling behind.

Federal Reserve G.19, August 2026 (preliminary).
32.5%

Of all household wealth is held by the top 1%. The bottom half holds 2.3%.

Federal Reserve, Distributional Financial Accounts, Q2 2026.
The last time ownership was this concentrated
  1. 1890Sherman Antitrust Act
  2. 1913Federal income tax (16th Amendment)
  3. 1914Clayton Antitrust Act
  4. 1916Federal estate tax

Economists estimate the top 0.1%’s share of U.S. wealth has climbed back close to its 1916 and 1929 peaks. The Gilded Age answer to concentration was new law. When people cannot own the machine, they change the rules for those who do.

Top 0.1% share: Saez & Zucman, “Wealth Inequality in the United States since 1913,” Quarterly Journal of Economics, 2016; academic estimates from capitalized income tax data, which other researchers estimate lower. Dates: National Archives; IRS Statistics of Income.

Barometer Falling · 4 · Door #4

When the promises can’t be paid, there are three ways out. And a fourth almost no one plans for.

  1. Tax more.Take a larger share from fewer workers.
  2. Pay less.Break the promise to those collecting.
  3. Print.Keep the promise in dollars that buy less.
  4. Lose control.The rescue stops working, and prices fall instead.

The first two take votes no one wants to cast. The third takes no vote at all. The fourth is not a choice.

Door #4

What happens when printing stops working?

For more than twenty-five years, each crisis has been met with easier money and more debt: 1998, 2001, 2008, 2020. Each rescue was larger than the last. If the next one would take more inflation than the system can bear, the printing press stops being an exit. What remains is deflation: asset prices fall toward what incomes can actually support.

It is the door almost no portfolio is built for. David’s framework takes it seriously.

I don’t predict when. My view today is that the fourth door, deflation, is the risk most portfolios are least prepared for, and my portfolios are built to act on it, while keeping the ability to move in either direction if I am wrong.— David J. Roskoph

See a storm building? Staying the course is a decision too. Is it worth the risk?

Get a free second opinion
Act II

Everyone on Autopilot

New money arrives on schedule, more and more of it into index funds that buy regardless of price. That steady bid helps explain why markets keep rising on autopilot. Everyone cannot win.

Everyone on Autopilot · 1 · The Flow

Half the money is on autopilot.

In 1995, about four cents of every dollar in U.S. stock mutual funds tracked an index. Today index funds hold the majority of all U.S. fund assets, and two of every three 401(k) savers own target-date funds that invest the same way.

Who’s flying the money
2025
Autopilot (index)52%
Pilots (active)48%
Autopilot has the controls

Drag through the years. Share of U.S. long-term mutual fund and ETF assets, ICI Fact Books. Morningstar dates the handover to the end of 2023: $13.3 trillion indexed against $13.2 trillion actively managed.

An index has no way to step aside
6001,0001,40020002003200620092012 March 2000 peak · 1,527 −49%Mar. 2000 to Oct. 2002 −57%Oct. 2007 to Mar. 2009 13 years from the 2000 peak to a lasting new high

S&P 500 price index, key closing levels connected by straight lines; not a full price history. Excludes dividends; with dividends reinvested, the recoveries were shorter. Historical episodes are not a prediction of future market events.

David Roskoph in flight gear, U.S. Air Force

Autopilot has no concern for deteriorating weather. It flies the course it was given.

David Roskoph, U.S. Air Force

An index can only profit when prices rise. When they fall, it has no way to step aside.

The concentration risk, in fullHow the flow concentrates, all 500 companies drawn to scale, and what followed 1973, 2000 and 2008
  1. 1
    New money arrives on schedule.

    Every paycheck contribution is invested automatically, allocated by company size, not by price.

  2. 2
    The biggest get the most.

    The largest companies receive the largest share of every new dollar, which lifts their weight in the index further.

  3. 3
    Concentration compounds.

    The flow keeps the index buoyant and the leaders heavier, round after round.

An index has no way to step aside
6001,0001,40020002003200620092012 March 2000 peak · 1,527 −49%Mar. 2000 to Oct. 2002 −57%Oct. 2007 to Mar. 2009 13 years from the 2000 peak to a lasting new high

S&P 500 price index, key closing levels connected by straight lines; not a full price history. Excludes dividends; with dividends reinvested, the recoveries were shorter. Historical episodes are not a prediction of future market events.

The S&P 500, drawn to scale by weight

10 companies 38% vs. 490 companies 62%

Dashed line: the previous record for the ten largest, 32.9% in 1963.

On average, each of the ten largest weighs as much as 30 of the other 490.

Tiles show each group’s average weight; actual company weights vary. Index weights as of June 2026 (peak 40.7% in December 2025). The most concentrated the index has been in at least 150 years of data. Global Financial Data.

Concentration this extreme has appeared before. The Nifty Fifty peak of 1973 and the dot-com peak of 2000 were each followed by declines of nearly half in the broad market (−48% from January 1973 to October 1974; −49% from March 2000 to October 2002). Not every concentrated market has ended that way. The ones that did were long and painful, for the leaders most of all.

Everyone on Autopilot · 2 · No Asset Leads Forever

No asset class leads every year.

U.S. stocks are often near the top. Over these eleven years they were never first, and in 2022 they ranked sixth of seven. The lead passed among crypto, the dollar and gold. A portfolio that can own only one kind of asset rides one horse. A Sonrise portfolio can change horses, and ride some of them in reverse.

2025
U.S. stocks ranked #3 of 7

    Calendar-year changes. U.S. stocks: S&P 500 total return. Global stocks: MSCI EAFE net total return (USD). Bonds: Bloomberg U.S. Aggregate total return. Precious metals: gold spot price. Energy: WTI crude front-month price. Currencies: U.S. Dollar Index. Crypto: Bitcoin price (USD). Bars are capped at ±100%; labels show the actual figure. Index and price changes, not Sonrise results; they exclude fees and expenses, and you cannot invest directly in an index. Past performance does not guarantee future results.

    Act III

    Hands on the Controls

    Built to seek gains when markets fall, not just to wait them out.

    So what?

    This may not be just another recession.

    Many portfolios have used only one move when the sky changes: wait. A Sonrise portfolio carries two tools most do not: eight asset categories instead of two, and the ability to go short as well as long. Before you decide whether waiting is enough, ask three questions of your own statement.

    1. Can anything in your portfolio gain if markets fall?

      Sonrise: yes. Every portfolio may hold inverse funds, designed to move opposite their index.

    2. Does it own anything besides stocks and bonds?

      Sonrise: eight categories. U.S. and global stocks, bonds, sectors, currencies, energy, precious metals and cryptocurrency.

    3. When did its mix last change because conditions did?

      Sonrise: as conditions change. Positions shift whenever the reading shifts, inside each portfolio’s disclosed limit.

    One portfolio. Eight channels. Two directions.

    Illustrative, not a market signal
    Sonrise portfolioLeverage in use
    1. U.S. stocks
    2. Global stocks
    3. Bonds
    4. Sectors
    5. Currencies
    6. Energy
    7. Precious metals
    8. Crypto

    Calm skies: mostly long, like the crowd, with leverage where the portfolio allows.

    A conventional portfolio: stocks and bonds, long only, the same posture in every weather.

    Conventional portfolio
    1. Stocks
    2. Bonds

    Long only. The same posture in every weather.

    Illustrative postures, not actual or recommended positions. They show the range a Sonrise portfolio may use, not what it will hold. David managed long and short positions for ten years (2008–2018) in a private investment partnership. A framework, not a forecast: debt, credit, Federal Reserve policy and market concentration decide how far each portfolio leans, inside its disclosed limit. Leverage is available in the Growth and Opportunity portfolios only. Read the full investment philosophy →

    Holding and hoping is not a strategy.

    Active management is.

    Inverse and leveraged funds carry added risks, including significant losses over short periods due to daily rebalancing. Cryptocurrency exposure involves heightened volatility and risk of substantial loss. No strategy can guarantee gains or protect against loss in a declining market.

    Hands on the Controls · How it works

    How a portfolio can gain when markets fall.

    Inverse funds are designed to move opposite their index for a single day. Leveraged inverse funds aim for a multiple of that move. Long/short strategies like these were once found mainly in private partnerships for accredited investors. Sonrise uses no-load mutual funds, held in your own account, with no minimum.

    See it on one bad day, and the catchWhy daily resetting makes these tools to be managed, not held and forgotten
    One bad day: the index falls 10%
    Index$100 → $90
    Inverse fund$100 → $110
    2× inverse fund$100 → $120

    On the day the market falls, inverse positions are designed to gain.

    The catch: a choppy market, up 10% then down 10%
    Index$100 → $99
    Inverse fund$100 → $99
    2× inverse fund$100 → $96

    Daily resetting erodes value when markets swing without a trend. That is why these are tools to be managed, not held and forgotten.

    Hypothetical illustration before fees and expenses, not the results of any actual fund or Sonrise portfolio. Inverse and leveraged funds seek their stated multiple for one day only; over longer periods their returns can differ significantly from that multiple. They involve added risks, including significant losses over short periods.

    Three portfolios

    One market view. Three levels of conviction.

    Our three model portfolios share one reading of the markets. What differs is how far each may act on it. Each has its own disclosed range: the needle can move anywhere inside it, toward long or toward short as conditions change, but never past its limit.

    Volatility ceilings are measured by standard deviation relative to the S&P 500. They are maximums, not targets: the portfolio may be run at lower risk, and actual volatility varies. Illustrative only: the arc shows each portfolio's relative range of positioning between short and long, not returns. Each portfolio's risk limit, strategy and costs are described in our Form ADV Part 2A, provided before any agreement is signed. See fees and how we work together ↓

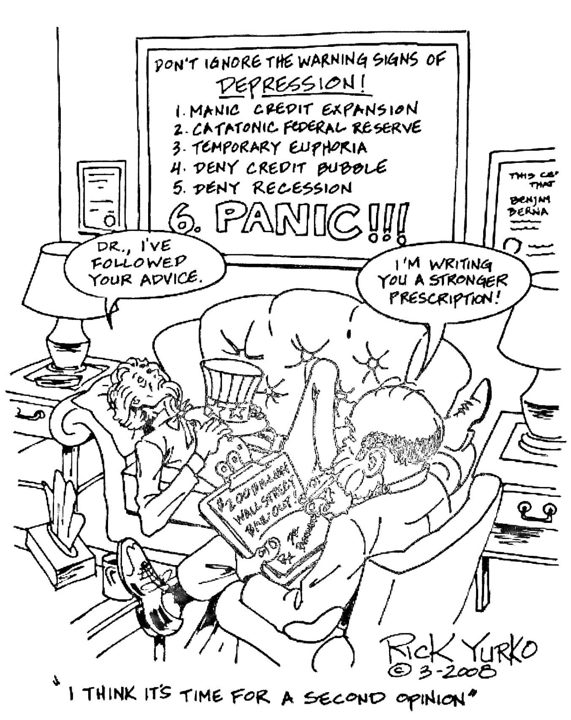
    Rick Yurko cartoon, March 2008: Uncle Sam, collapsed in a chair, tells the Federal Reserve doctor “I’ve followed your advice”; caption: “I think it’s time for a second opinion”
    “I think it’s time for a second opinion.” Rick Yurko, March 2008. Ran with David’s Seeking Alpha article of March 17, 2008.
    A free second opinion

    Does it still look like clear skies ahead? Get a free second opinion.

    If you still believe it is business as usual and clear skies are ahead, thank you for visiting. If you see a systemic challenge, a second opinion is only a few keystrokes or a phone call away.

    Keep your adviser. Your portfolio may be a good one. It is almost certainly built for one direction. In twenty minutes, at no cost and with no obligation, David will look at what you own through the lens of this page, the storm, the crowd and the fourth door, and tell you plainly where it is exposed. If part of it belongs in a portfolio built to act in both directions, you will see how much, and why. There is no account minimum.

    80% stays where it is. 20% gains the ability to act in either direction.

    An illustration of how assets could be divided, not a recommendation and not a depiction of returns. The right portion depends on your goals, circumstances and tolerance for risk, and we decide it together after you have read our Form ADV.

    Who’s running it · On the record

    Published in both directions.

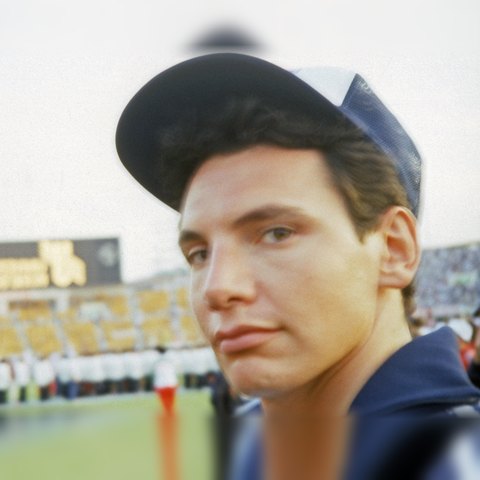
    David Roskoph in the stadium at the World University Games
    At the World University Games, fencing

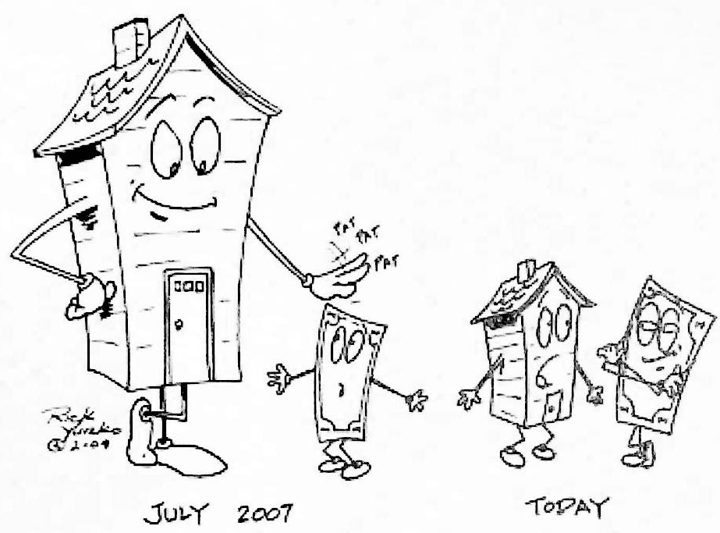
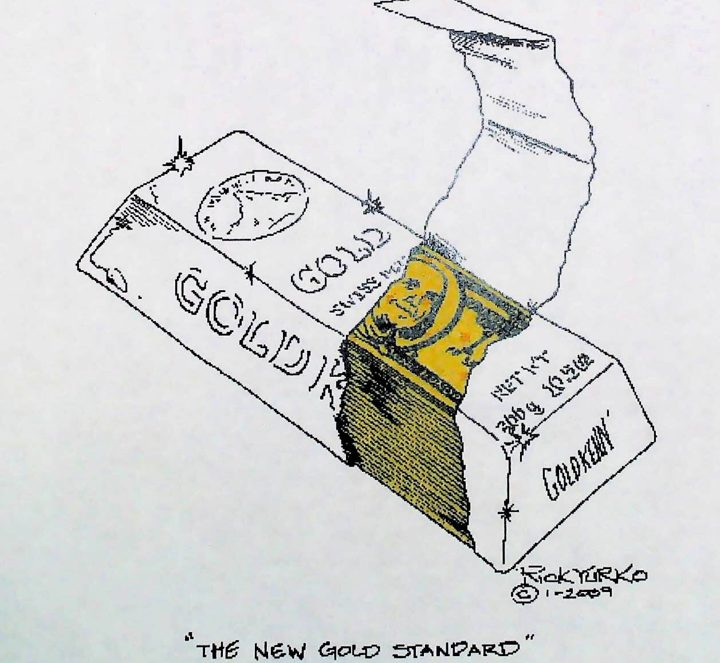
    David has spoken and written publicly about markets since 1999, warning of risk when he saw it and making the case for recovery when he saw that. Every piece was dated and published under his own name at the time.

    Open on YouTube

    Swipe for more articles →

    Caution, published ahead of the October 2007 market peakOptimism, published ahead of the March 2009 market low

    Read all 23 articles →

    Three of David’s 23 Seeking Alpha articles appear above: one before the 2007 peak, one in the crisis and one before the 2009 low. Tap any card to read the full article. All were written during his prior advisory practice and are historical commentary: not a forecast of future markets, and not a recommendation to buy or sell any security. Timing is measured from each article’s Seeking Alpha publication date to the S&P 500’s closing high of 1,565.15 on Oct. 9, 2007 and closing low of 676.53 on Mar. 9, 2009.
    The thinking behind it

    Seven convictions, in David’s own words.

    1. Markets don’t only go up.
    2. Every rescue borrows from the future.
    3. The people paying the bill are disappearing.
    4. Complacency never shows up on a statement.
    Read the investment philosophy →
    Working together

    Four steps. Nothing hidden.

    No account minimum. One wrap fee: 1.25% a year under $500,000, declining to 0.25% above $5 million. You see the fee, the risk limit and the custodian before anything is signed.

    The four steps and full fee scheduleConversation, choose your limit, your account in your name, one annual fee
    1. 1

      A 20-minute conversation.

      In person in Richmond, by phone or by video. No cost and no obligation.

    2. 2

      Choose your limit.

      Together we match you to Moderate, Growth or Opportunity by the most risk you are willing to carry, and you read the full Form ADV first.

    3. 3

      Your account, in your name.

      Assets are held at Charles Schwab in your own name. You see every position and every trade.

    4. 4

      One annual fee.

      A single wrap fee covers management, Schwab trading and custody: 1.25% a year under $500,000, declining to 0.25% above $5 million, billed quarterly. Negotiable. Fund expenses are separate.

    Full fee schedule, services included and costs not included: Wrap Fee Program Brochure. A wrap fee may cost more or less than paying for advice and trading separately, depending on how often your account trades.

    Before the weather turns

    Every portfolio flies in fair skies. Fewer are built for storms.

    You sensed something was amiss before, and holding on was the right call: every major decline of the past twenty-five years ended with a rescue. You don’t have to leave what has worked. You also don’t have to bet everything on the next rescue.

    Waiting it out assumes the next rescue will come. Moving everything to cash assumes the storm never ends.
    There is a course between the two.

    We start with three questions: What are you protecting? What income must your portfolio produce? How would you really respond to a hard decline?

    The full briefing

    Pilots don’t get their weather from the evening news.

    This page is the summary. Before any flight, a pilot gets the full weather briefing: every layer, every hazard, every alternate. The full briefing on markets is too much for one page, and the part that matters most is about your own portfolio. That takes a conversation.

    On this page
    • The federal debt and the cost of carrying it
    • Who is left to pay for Social Security and Medicare
    • Who owns what the rescues lifted
    • Four ways out, and Door #4
    • How much money is on autopilot
    • Why no asset class leads every year
    In the full briefing
    • Your own portfolio, line by line: what it can and cannot do if markets fall
    • Debt, personal and public
    • The Centillion effect
    • The health of the consumer
    • The social contract
    • The possible resolutions
    Request the full briefing
    Dinner briefings

    The full weather briefing, over dinner.

    A few times a year David hosts a small dinner in Fort Bend County: one topic, one evening, and time for your questions. An educational evening. Seating is limited, and David calls to confirm every seat.

      Reserve a seat

      David will call to confirm. Please do not send account numbers or other sensitive information through this form.

      Contact

      Check in with the tower.

      Twenty minutes to review your flight plan before the weather turns. In person in Richmond, by phone or by video, with no obligation. David replies personally.

      Office
      1722 Pecan Crossing Dr
      Richmond, TX 77406

      Please do not send account numbers or other sensitive information through this form.

      Get a free second opinion